Mathematical Transformations
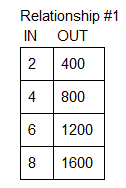
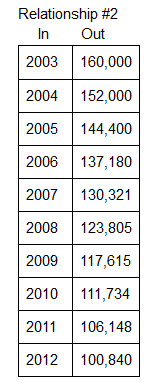
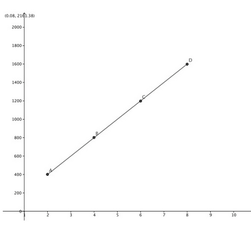
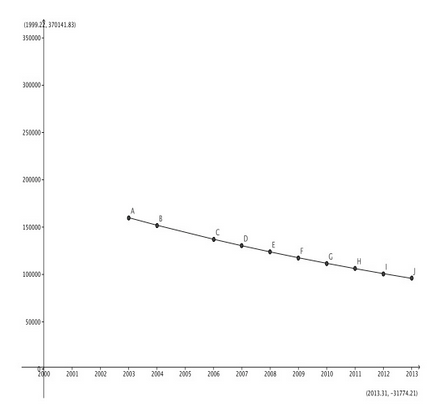
For this project we focused on the difference between linear and non linear relationships in data. The purpose of this project was to look at data and to be able to identify whether it is linear or non linear without graphing it. For this project, we were to obtain data, either by doing research or conducting experiments, about any topic of our choice, and display our data in a creative piece as one linear relationship and one non linear relationship. I am an animal lover, so I wanted to use data that had to do with animals. For my linear relationship, I used data of the amount of spots on giraffes. I obtained my data by researching giraffes, mainly on the San Diego Zoo website, until I found the data I needed. For my nonlinear relationship, I researched the decrease in giraffe population over the last ten years. I found out that there was a 5% decrease each year in giraffe population starting in 2003. I also found out that in 2003 there was an approximated 160,000 giraffes on Earth. I used this information to calculate the approximate giraffe population for each year. To the left, you will see the tables I made for this data for each of my relationships. Below there are two tables displaying the data from my linear and non linear relationships, and graphs of the data. To determine whether or not a relationship is linear or not, there are two things you should look for. A relationship is linear if the data increases or decreases in proportion to each other, or if when graphed, the data creates a straight line. You can see that Relationship #1 is linear because when the "In" increases by two, the "Out" increases by 200 therefor the relationship is linear. Also, when this data is graphed, it creates a perfectly straight line, proving the relationship to be linear. Relationship #2 is nonlinear because the data does not decrease in proportion and when graphed, it creates a curved line. For my creative piece I wanted to display my data in a cool way that incorporated with giraffes. I decided to make a little diorama that was safari themed that I could put giraffes in as well as the graph. I initially thought about purchasing little giraffe figurines, but I thought it would be a lot cheaper to learn how to make origami giraffes instead. I think the creative piece was the best part of this project. It met criteria and turned out to be just how I pictured it. I think my creative piece turned out so well because I was persistent and even though it was difficult to create and it took me a long time, I was determined to make it work. A challenge for me in this project was calculating the giraffe population for each year because I kept getting the numbers mixed up and wound up having to redo it several times. I think that if I would have stayed more organized, it wouldn't have been so difficult but while I was doing my calculations I wasn't very near or organized with my work.
|
|
