Mathematical Model of Me
In the Mathematical Model of Me project, our class had to take a photo of something that is important to us and then make it mathematical by putting it on a graph. In order to make it a graph, we used a program called "Geogebra". This website allows you to input plot points, on a grid which you can scale. Then, you click the "Create Poly line" tool, and it will create your figure. The purpose of this project was to increase our skills at using Geogebra, and expanding our knowledge of geometry and graphing.
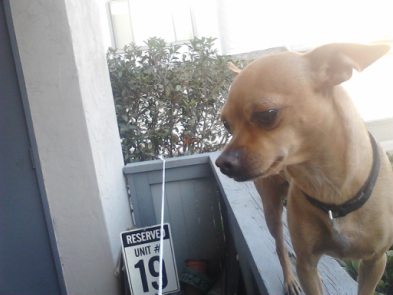
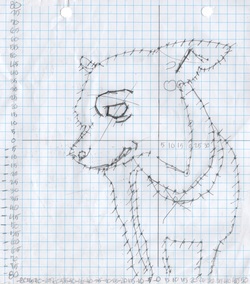
I picked this image to represent me because it is a picture of something that is really important to me. This is a picture of my chihuahua, Beans, who went missing November of 2011. Once I had chosen a photo, the next step was to trace the outline with a black marker, to make it easier to see. After that, I taped the original photo to a lit window, and I taped a sheet of graph paper over it, this made it much easier to trace. Next, I drew y-axis and x-axis, and labeled all of the ticks on my graph (I used a scale of five). Once I had my outline on graph paper, I had to find all of the coordinate points I would need to make the image as detailed as possible. At first, I only started out with the points that were on perfect x and y-values, but there just weren't enough there to finish it. I then, drew all of the points that were plotted perfectly on at least one x or y-value, and I plotted some odd ones that would add to the detail. Next, I wrote out all of the coordinates for the points to make it easier to input them into the computer. Then, I had to put all of the coordinates into Geogebra. To do that, I had to set my scale. Then, I would input all of the coordinates of one aspect of the picture,(like "ear", "eye",etc...) input all of it's coordinate points, and then click on the "create poly line" tool to make the object appear. Once the entire image had been complete, I had to make it beautiful. Originally, I was just going to color it in, but I decided that I could do better. So, I colored in my image, scanned it into my computer, and I got creative with Photoshop. The picture above is my final product for this project. For the background, I found a picture on Google images that I liked, and then I took a blog post that I had written about Beans and added it in the background as well.
A mathematical model is a description of a system using mathematical concepts and language. Complex imagery can be modeled mathematically by doing what I did for this project, graphing it on paper or on the computer. Productivity software can be used for graphing by making a program like Geogebra.